• RSS
  • Design and Simulation:These are some books which are recommended as a reading list. 1- Aerodynamics of Road Vehicles from Fluid Mechanics to Vehicle Engineering. Edited by Wolf-Heinrich Hucho 2- Hucho-Aerodynamik des Automobils Stromungsmechanik.Warmetechnik. Fahrdynamiik.Komfort
  • Optimizing Performance and Fuel Economy of a Dual-Clutch Transmission Powertrain with Model-Based Design.
  • Wind Turbine DesignPrimary objective in wind turbine design is to maximize the aerodynamic efficiency, or power extracted from the wind. But this objective should be met by well satisfying mechanical strength criteria and economical aspects. In this video we will see impact of number of blades, blade shape, blade length and tower height on wind turbine design.
  • Modelling Complex Mechanical Structures with SimMechanicsModeling physical components or systems in Simulink® typically involves a tradeoff between simulation speed and model fidelity or complexity: the higher the fidelity of the model, the greater the effort needed to create it..
  • Biomass Energy Vs. Natural GasIn 2009, natural gas prices plunged to below $4 per MMBtu where many "Experts" are saying that prices will remain low for decades as a result of technology break-throughs allowing for sizable increases in natural gas supply for North America. The Energy Information Agency (EIA) just released data projections reflecting this potential increased supply in natural gas.

Thursday, 26 December 2013

Spin Doctors on U.S. Oil Production, Costs, and Energy Policy.

Posted by Sohail Azad On 19:25

Spin Doctor: A person (such as a "Talking Head") who tries to control the way something is described to influence public opinion in a way that helps their side and hurts (often demonizing) differing views. "Spinning" always contains some elements of truth to enhance credibility, but conveniently overlooks/dismisses any facts not helpful in forming the desired public perception.

Current Status of U.S. Foreign Oil Dependency: Over the past 7 years, the amount of oil supplied from foreign sources has decreased from an all-time record peak of 60% in 2005 to currently ~40%. While lower oil consumption (resulting from economic recession, greater auto efficiency) has played a part, this amazing (and hopefully sustainable) achievement has been primarily the result of technology advancements in oil extraction.

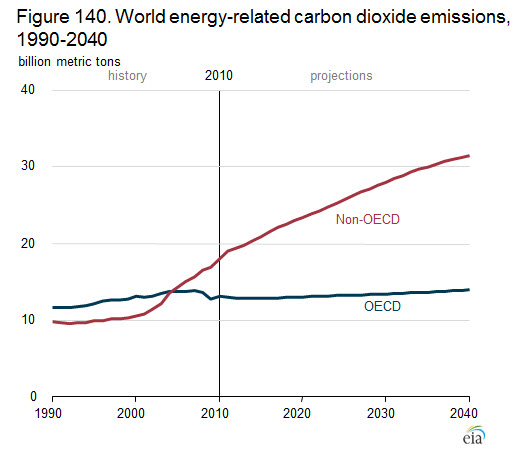
Per the U.S. Energy Information Agency's (EIA) long-term forecast, foreign oil use is expected to decline even further (with an estimated 32% from oil imports by 2040).

Through the extensive use of fracking and horizontal drilling, almost all of this domestic growth in oil and natural gas production is occurring in six U.S. regions:

History of U.S. Oil Production
& Consumption:
Increased U.S. Oil Production Growth Regions

What Spin Doctors Don't Tell Us On U.S. Foreign Oil Dependency: In this renaissance of U.S. oil production, one often hears the sound-bites of "Energy Independence", "Freedom from Mid-Eastern Oil", "Canada is now America's #1 Oil Importer". The problem with these now generally held public perceptions is that they don't exactly tell the full story.

While it is correct that Canada is now the "single country" largest exporter of oil to the U.S., the Mid-east dominated oil cartel of OPEC (which includes a very oil-hostile Venezuela) remains America's largest supplier of foreign oil.

Putting the above chart into a global perspective, OPEC oil consumed in the U.S. is more (or about equal in the case of Japan) than the "total" amount of oil consumed in other leading industrialized nations:

U.S. OPEC Oil Imports Versus
Total Oil Consumed in Other Nations
Understanding the massive U.S. appetite for oil is pretty simple -- the American "love affair" with cars. Compared to the rest of the world, the U.S. remains hopelessly addicted to gasoline. Americans (per capita/person) consume more than 300 gallons of gasoline per year, which is by far the highest among 128 countries. That's more than three Germans, or ~7 people in France.

Use of Cherry-Picking Ideological Arguments: Perhaps the most hypocritical example of selective cherry-picking by "Spin Doctors" is the commonly used "sound-bite": "Free Markets should determine energy winners and losers, not big-government".

The following graph (using EIA data) breaks out the individual components of current pump gas prices -- where U.S. consumers currently "have no choice" but to pay 37� per gallon to OPEC for crude oil costs.1

From an ideological argument perspective, this is the equivalent of a mandate that 16% of all gasoline be blended with OPEC oil. 2

Components of Gas Pump Price
(U.S. average of $3.34 per gallon @ November 2013)

1 69% of the current pump price of gasoline is crude oil costs ($2.30 per gallon). 40% of all crude oil is from foreign sources (92�). 40% of foreign oil is from OPEC (37�).
2 40% of all oil consumed is from foreign sources and 40% of foreign oil is from OPEC (40% times 40% equals 16%.)

OPEC is anything but "free market trade" -- a cartel that manipulates markets, restricts output and fixes prices that's had a devastating effect on the U.S. economy. But OPEC's reach is beyond just its Middle-East members, where Venezuela has nationalized and continues to seize U.S. Oil Companies' assets.

What The Spin Doctors Don't Tell Us On Economics: The message of "Drill, Baby, Drill" has mass public perception appeal of basic supply/demand economics that even a caveman can understand. It's just common sense that if U.S. oil production increases (by removing "big-government" barriers) that gasoline prices at the pump will decrease -- Right? Well, not exactly.

An inconvenient fact is that extracting oil using fracking and horizontal drilling technology has dramatically higher costs than in typical Middle East oilfields. According to Oil Analysts, the average cost of new oil production from U.S. tight oil and shale gas regions is ~$70 a barrel, with marginal costs (the last barrels produced) as high as $114 a barrel in 2012.1, 2, 3

Conversely, for conventional oil output in the Middle East, average production costs are just over $20 a barrel , with marginal costs at ~$30 per barrel.

World-Wide Marginal Production Cost of Oil

While there are numerous economic benefits in developing domestic energy resources (e.g., job creation, economic development, reducing the massive U.S. Trade Deficit) -- expectations of significantly lowering the "current" price of crude oil isn't one of them. Simply stated, because of the high extraction costs of advanced technologies, increased U.S. oil production is totally dependent on maintaining high oil market prices.

In order to achieve claims made by "Spin Doctors" for a return to $2 gasoline by increasing U.S. oil production would require a precipitous price drop to ~$40 a barrel (bbl) -- a market price significantly below either the average (~$70/bbl) or marginal (~$110/bbl) costs to extract oil using fracking/horizontal and deep-sea drilling.

We Need to have a "Real" Energy Policy Debate: In order to have a meaningful dialog everyone needs to pause, take a deep breath, and move away from the extreme polarization that partisan "Spin Doctors" create. Energy policy shouldn't be limited to "Red State vs. Blue State" tunnel vision on any one specific "hot button" issue (ranging from Conservatives mistrust of big government to Environmentalists' adamancy? on Climate Change).

It's about addressing a myriad of problems and trying to solve them -- compromising and finding common interests in a bigger picture rather than focusing on things that divide us.

Overlapping Issues with Energy Policies:

Additional News Stories:
In U.S. Public Opinion Polls, Saudi Arabia is viewed very unfavorably.
Record Growth in U.S. Oil Production.
Global Oil Prices and Energy Security
Fact Check on Keystone Pipeline Claims

Wednesday, 27 November 2013

Where Obama Is Wrong on Coal

Posted by Sohail Azad On 11:53

Update! While Environmental Organizations are outraged, the recent Budget Bill in Congress rescinded the Obama Administration's banning of the Export-Import Bank to finance any coal power plants.

Coal Use in Developing Countries: As part of it's policy initiatives to reduce global carbon emissions, the U.S. is ending support for new coal-fired plants around the world. Except in "rare" situations of poverty (whatever that means), the U.S. will no longer contribute to coal projects financed by the World Bank and other international development banks.

Like other top-down attempts by governments to control carbon emissions (taxes, treaties), this U.S. "no new coal" policy uses an incorrect paradigm, and will not result in meaningful and needed global reductions.

A correct approach must always balance present humanitarian and economic needs with long-term climate science objectives -- utilizing a bottom-up model, tailored to provide multiple pathways to develop and sustain individual economies with needed lower carbon standards.

The Other Inconvenient Truth: While the below facts are on India (EIA data), these harsh realities are found throughout the developing world where poverty is common, not rare (e.g., India, Asia, Indonesia, Africa).

India suffers from severe shortages of electricity, where only 60% of rural households have access to electricity.

Rural areas rely on traditional biomass for cooking, heating, and lighting because they lack access to other energy supplies.

The biomass used in "open burning" is 62.5% from firewood, 12.3% from agricultural wastes, and 12.3% from animal dung.

Nearly one-fifth of today�s global population � 1.2 billion people � lives without access to electricity. Two-fifths of the population � 2.8 billion people � still relies on solid fuel such as wood, charcoal, cow dung, and coal in low-tech cooking and heating.

Often, it seems as though Industrialized Nations and Environmental Organizations become so overwhelmed by the specifics of Climate Change science (e.g., CO2 PPM) that they lose focus on people -- where 35% of the Earth's population (2.5 billion people) don�t even have access to a basic human need of having a toilet.

A correct paradigm recognizes that reducing global carbon emissions is intrinsically linked to reducing world poverty. Addressing this just isn't about industrialized countries providing direct financial aid, but includes issues such as international trade and technology transfers to developing countries.

Size of World If Scaled by Poverty:
(43% of the world population lives on $2 a day or less.)

World Coal Use: In writing this blog, the issue of "tone" is always important. Criticism of the U.S. No-Coal Policy is not saying that world coal use isn't a major concern (where 43% of current CO2 emissions from fuel combustion are from coal). The problem is the rigidity of a "One Size Fits All" Policy for every developing economy.

A chart from the latest U.S. Department of Energy's (EIA) International Energy Outlook to 2040 illustrates this point.

The future global Climate Change problem with coal use is overwhelmingly from China, not "all" developing countries.

For example, while coal use in India and the U.S. is projected to be approximately equal, India has 4 times the U.S. population (~1.2 billion versus ~300 million people) -- resulting in much lower emissions per-capita (per person).

Carbon Emissions Per Capita: The disparity in carbon emissions per-capita between industrialized countries versus developing economies has and will continue to be a major stumbling block in achieving any consensus on needed global actions.

In the U.S., carbon emissions are currently over 19 tons per person -- a consumption rate over 17 times that of India (~1 ton per person).

Can International Treaties Ever Work?: At the latest U.N. sponsored conference on Climate Change in Warsaw, three events continue to raise "red flags" on the potential effectiveness of making international treaties the "centerpiece" in efforts to reduce global carbon emissions.

(1) The Double Standard Argument: There is increasing skepticism whether "any" meaningful agreement between industrialized and developing countries can ever be reached. Brazil's recent proposal (supported by 130 developing countries) would use carbon emission levels dating back to the industrial revolution to set limits on future emissions. Not surprisingly, the U.S. and EU rejected this proposal.

(Nations Scaled By Cumulative Emissions)
Developing countries argue that because Western industrialized nations have been emitting tremendous volumes of greenhouse gases for over 200 years, they must bear the most responsibility to rein in greenhouse gas emissions.

(2) Can Treaties Really Ever Be Binding?: Japan (the world's fifth largest greenhouse gas emitter) announced a scale-back in its plans to reduce carbon emissions from 25% to just 3.8% (which is actually a ~3% increase from 1990 levels). While Japan's action is certainly understandable resulting from the 2011 tsunami and earthquakes -- this raises a question whether any international treaty could ever be truly binding. Exceptions, ranging from natural disasters (as again recently demonstrated in the Philippines with typhoon Haiyan) to economic hardships will always be present.

(3) Money, Money, Money: As in prior Climate Change conferences, the critical issue of "who pays for necessary actions" was again never seriously addressed (with political reality). The general number tossed around is needed financial support (direct aid, loan guarantees) from industrialized to developing countries of $100 (�73) billion per year.

When Rigid Ideologies Drive Policy: While most environmental groups are applauding this U.S. "no new coal" policy, both they and the Obama Administration are wrong in the paradigm they have created. This policy action is yet another example of the rigid ideological polarization that divides America on so many things today -- where issues are routinely defined (and demonized) in terms of a black-or-white (either/or) paradigm with no gray area that could lead to positive and productive compromise.

The U.S. "no new coal" policy exemplifies this polarization of black/white ideology in solving complex problems. While coal use is clearly a problem, it isn't "the only major" problem. Not only is this U.S. Policy position laden with hypocrisy (coal use per capita in the U.S. economy), it defies the reality that coal will continue to be a major energy resource in the developing world.

Size of World if Scaled by Coal Use:
A constructive approach is how to make coal use more efficient, where a multitude of technology options exist. Especially in manufacturing, production efficiency gains can be much more than marginal improvements.

(No unilateral U.S. action will achieve major global reductions in coal use.)
(A "My Way or the Highway" approach
isn't pragmatic or productive.)

The Case For Different Pathways: Perhaps the best illustration of providing flexibility through "multiple pathways" to lower carbon emissions is Germany, which is:
-- Dramatically transitioning their energy sector to renewable energy.
-- Investing heavily in energy efficiency ("Smart Grid" infrastructure).
-- Achieving high economic growth.
-- Sizeably reducing carbon emissions
-- Also bringing new coal-fired generation on-line.

Germany's share of electricity produced from renewables has increased from 6.3% to over 25% since 2000. Relative to 1990, Germany has also reduced its carbon emissions by 25%.

However, contradictory to the U.S. "no new coal policy", Germany is currently implementing its biggest new-build program for coal stations in over a decade -- increasing its coal-fired generation capacity by 33%.


Is this a picture of a vase or two
people looking at each other, or both?
The Need For A Mental Reboot: Just because a view doesn't "fit" or "appears" contradictory to a established paradigm/model doesn't necessarily mean its wrong. There's usually always more than just one way in viewing and solving complex problems.

The goal is to achieve a productive "end-result" -- not ideologically pure ways (e.g., no new coal) of how to get there.

Moving Forward: To achieve meaningful and sustainable reductions in global carbon emissions a major "paradigm shift" is needed -- moving away from rigid black/white ideologies (which the U.S. no coal policy represents) to a lower carbon standard (LCS) model (a comprehensive approach as being used in Germany).

As stated in previous blogs, it is strongly believed that international trade should be the centerpiece of this new paradigm. A good starting point is to create the equivalent of "Enterprise Zones" within developing countries (especially free markets economies of India and Indonesia) providing: (1) significant and unprecedented new trade incentives into U.S. and European markets for manufactured products using a "Low Carbon Standard" (LCS); (2) Significant transfers (including financial assistance and less restrictive patent protection) of advanced energy and manufacturing technology into these Enterprise Zones.

Sometimes the pathway in developing countries may look like what has been accomplished in Western Industrialized Economies -- sometimes it may not. Most often, a LCS pathway in developing economies will require a "bridge approach" (with definitive benchmarks that must be achieved to keep new trade incentives) in transforming to the LCS objective.

An example of needing a "bridge approach" is the argument that scaling up renewable energy technologies (intermittent wind, solar) have been demonstrated to be competitive with base load fossil fuel generation. What this argument fails to mention is that this competitiveness is highly dependent on having an advanced large (national, regional) transmission "Smart Grid" (which does not yet exist in developing countries).

Liberal versus Conservative?: Only by using bedrock conservative principles of de-centralization and free markets will the prize of sustainable reductions in carbon emissions be attained.

Facebook:

Additional Stories:
In War on Coal, Coal is Winning (C.S. Monitor)
Kenya postpones Wind and Solar Energy Projects because of high costs.
Geothermal energy crippled in Philippines from Typhoon Haiyan.
World Coal Consumption To Surpass Oil By 2020
NY Times Op/Ed: Coal use in developing countries
More opinions on poverty and coal use in developing countries
Trade/Climate Change Policy: U.S. Liquid Natural Gas Exports?
U.S. Hypocrisy to Undermine EU LCS Standards on Tar Sands Exports
Public Opinion Polls: Views on Global Warming -- U.S. Versus World
Germany set records in coal use.
Wall St. Investment Firm Backs Away From Major Coal Export Project
Solar and Wind Vs. Coal in South Africa
U.S. Regulators Struggle on Writing New Coal Regulations
Climate Change Can't Be Solved on Backs of the World's Poor.

JGHG5CK4C5MZ

Sunday, 3 November 2013

Global Warming & International Trade -- the Elephant in the Room.

Posted by Sohail Azad On 19:11

Update! In a new Stanford University Survey a majority of Americans believe man-made Global Warming is occurring, but do not support a Carbon Tax.

The Global Greenhouse Gas Conundrum: In BP's Annual Energy Outlook to 2030, World carbon emissions from energy use are projected to increase by 26% by 2030. This increase will primarily come from developing countries (e.g., China, India) as they industrialize their economies (as Western economies did during their Industrial Revolution, called the Kuznets Curve).

The primary fuel source for powering Asian industrialization will be their vast natural resources of coal, where coal prices are currently about one-third of Liquefied Natural Gas (LNG) and about half of natural gas.

The biggest carbon emitters among developing nations have made clear that while they are prepared to improve the energy efficiencies of their economies, they have no interest in capping carbon emissions that restrict economic development.

The Politics of Climate Science in U.S.: Many Conservatives twist valid science uncertainties of Climate Change/Global Warming (e.g., Dr. Judith Curry) to become "Deniers" -- arguing that no economic policy actions (e.g., Carbon Tax) are needed. Conversely, Liberals often use a message of apocalyptic doom/gloom to advance climate policy actions. But for most Moderates/Centralists, they just don't "easily fit" in either of these highly polarized groups.

Question: What happens if you (A) Believe in the science of Global Warming, but (B) Disagree with a U.S. Carbon Tax Policy?

Answer: You find yourself in the middle of Red State vs. Blue State, Conservative vs. Liberal, Culture and Political Ideology Wars.

The Mind of "Sympathetic Greens": While Moderates/Centralists are concerned about Climate Change, a major roadblock in their supporting U.S. policy actions is the conundrum of carbon emissions from industrialization in the World's developing economies. These "Sympathetic Greens" recognize a fundamental reality: The U.S. alone (or even the developed world as a whole) can not reduce global CO2 concentrations. Unilateral U.S. actions may be admirable (lead by example), but are quixotic.

While a Carbon Tax would undeniably reduce energy consumption in the U.S. (especially among poorer Americans as a regressive tax), how would this impact total Global emission levels? Could an unintended outcome be even more "outsourcing" of greenhouse gas emissions from the U.S. to developing countries? (increasing the already huge U.S. Trade Deficit). Liberals never really address these type questions.

Growth Rates in CO2 Emissions
A New Path: A Policy option that just might get us out of this ideological mess and also actually achieve meaningful reductions in global greenhouse gas emissions is by thinking "outside the current box" -- Using international trade agreements between the U.S./EU and developing countries.

The below chart illustrates the global CO2 impact of international trade where the flow of emissions are allocated to the locations where global goods and services are produced and then consumed -- where Chinese exports to the U.S. and the EU clearly dominate.

Major Global Flows of CO2 From Production to Consumption:
Start of Arrow: Fossil Fuel Consumption (Production)
End of Arrow: Goods and Services Consumption

Responsibility of the U.S. and EU: To be successful, using international trade to sizably reduce Global CO2 emissions must be a constructive two-way-street with shared responsibility and recognizable benefits -- not driven by parochial interests leading to confrontation (use of free/liberalized trade agreements versus unilateral tariffs/sanctions resulting in trade wars).

As the World's largest economies, Western industrialized countries must recognize, accept, and act on their unique responsibility:

Since a significant percentage of CO2 emissions likely remains in Earth's atmosphere for thousands of years, the bulk (perhaps up to 80%) of current CO2 PPM levels (with a man-made footprint) comes from Western industrialization which began in the 18th century.
Underlying Principle of Free Trade: The U.S. has advocated free-trade policies for decades, but it also has spent considerable effort and diplomatic capital in creating both global and regional trade rules/standards (WTO, NAFTA) -- based on the acceptance and implementation of trade policies by other members (with verifiable actions).

If Climate Change is to be truly treated as serious on a global stage, pragmatic lessons must be drawn from international trade -- where reciprocity reigns supreme. No country eliminates its trade barriers without reciprocal and meaningful concessions from trading partners.

Its ironic that ultimate success in addressing Climate Change will depend as much on social sciences of "human nature" rather than just the physical sciences in resolving climate uncertainties. A good analogy is why young people still smoke, given the overwhelming medical evidence that it's harmful -- The difficulty of making a lifestyle change today to avoid the consequences in 20, 30, 40 years. People also need near-term positive incentives -- like wanting to go out with that "Hot Girl or Guy" who only dates non-smokers.

International Trade Incentives: As the World's largest economies, the U.S. and EU have the ability, opportunity, and responsibility to provide needed positive incentives to developing countries. An illustration of a "concept framework" of trade incentives is California's Low Carbon Fuel Standard.

Applied to international trade, specific products from developing countries meeting a "Low Carbon Standard" (LCS) would be given greater/favored trade access into U.S./EU markets (achieving a competitive advantage over other countries that don't participate in LCS Free/Liberalized Trade).

Correcting a Major Policy Mistake on Climate Change: After the Kyoto Protocol in the late 1990's, a major policy error was the missed opportunity to create "Idea Incubators" with developing countries in existing Free Trade areas (especially India and the Philippines). Such an effort could have created "Success Stories", developing and demonstrating a "Model" for specific multi-lateral trade actions and collaborative cooperation (Western technology transfers and financial assistance) that could be then scaled up to sizably reduce CO2 emissions in developing countries.

It's not too late to correct this mistake, it just will take political resolve by Western industrialized nations to do not just the "right thing as to responsibility" but the "smart thing".

Multi-Lateral Free Trade Areas
(Below Countries in Red)
The following is a conceptual framework of beneficial trade reciprocity between industrialized and developing countries (Wins/Wins) to reduce global CO2 emissions.

Industrialized Nations

High Tech Energy Efficient Goods and Services

(Including U.S. natural gas exports)

Developing Economies

"Low Carbon Standard" Products

(With favored US/EU Trade Status)

Facebook:

Additional News Stories:
Views on Global Trade by Country -- (Pew Research).
In War on Coal, Coal is Winning (C.S. Monitor)
China's Coal Demand Set to Double.
Emerging Economies Nearing One-Half of Global CO2 Emissions.
Argument that U.S. Carbon Tax Would Have Minimal Impact (0.1�C ).
Dramatic Decrease in Carbon Intensity in U.S. Economy
Why A Carbon Tax Will Not Work -- and What Will.
U.S. to Help Ukraine with Natural Gas Development

JGHG5CK4C5MZ

Monday, 21 October 2013

The Past, Present, and Future of Ethanol

Posted by Sohail Azad On 14:07

In our last 2 blogs, the past to the present of ethanol is discussed -- looking at the health origins of why its use was needed in the first place, and ethanol's continuing importance today in reducing U.S. spending on foreign oil (OPEC).

Today we will look at the future, but first let's do a quick review:

Health Benefits
War, Terrorism, China, & Oil

Origins in Health Benefits: This blog post discusses some key aspects of gasoline formulation and how a blend rate of ~10% ethanol (E-10) replaced previously used health threatening additives (lead for octane requirements, MTBE for fuel oxygenation). These health benefits from cleaner fuels (reducing rates of cancer, child autism, asthma, etc.) have been firmly established in medical science for decades.

Consequences of OPEC Oil Dependence: This blog "connects the dots" of past and continued U.S. dependence on Mid-East oil to:

  • Terrorism & War: From the attacks of 9/11 to now Syria, the
        dirty footprint of oil money to fund/cause these conflicts always
        emerges as a common denominator.
  • Financial Strength of U.S.: Over the past 30 years, the U.S. has
        reportedly now spent ~$8 trillion to protect the flow of oil in the
        Mid-East. In a context of the current debt ceiling debate, this
        would represent about one-half of all outstanding U.S. debt.
  • Opportunism by China in the Middle East: The biggest benefactor
        of U.S. "blood and treasure" is China, as they are now the #1
        customer of oil
    from Iraq and other Persian Gulf Countries.
  • Economic Strength of the U.S.: Historically, the two primary
        causes of the massive U.S. trade deficit has been imports of
        foreign oil and Chinese products -- resulting in the vast transfer
        of American wealth and jobs to the Middle-East and China.
  • Understanding the Drivers of Ethanol's Future. Of total gasoline currently consumed in the U.S., ~10% is blended with ethanol.(1) Ethanol at E-10 blending levels represents the lowest cost clean-fuel option to meet health standards for needed non-lead octane and oxygenate requirements -- with estimated consumer savings of ~34� per gallon below other available options.(2)

    But with the growth rate in gasoline consumption (needing E-10) expected to remain flat (less consumer demand as a result of greater auto MPG, the economic recession, and oil prices above $100/bbl), any meaningful volume increase in ethanol use will only occur with blending rates above 10% (E-15 to E-85).

    Under the Renewable Fuel Standard (RFS) "targeted" increases in ethanol use are scheduled (below graph). However, these "targets" are not "set-in-stone" mandates. The appropriateness of required yearly volume levels are reviewed each year, and must consider current market factors such as price and available biofuel supply.

    Since the use of E-10 is inextricably tied to compliance with clean-fuel requirements, it is highly unlikely to inconceivable that the use of E-10 could be "eliminated or totally voluntary". Questions that anti-ethanol proponents never address are: "What would they replace it with? -- and what would be the cost?"

    What is highly in doubt however, is the implementation of RFS requirements above a current 10% blending level (called the blend wall) either by the EPA (which administers the RFS Program), or through Congress (new legislation to modify or even eliminate the RFS). Since blending levels above ~10% are not required to meet current clean-fuel requirements, the argument for increased ethanol use changes -- from health benefits to primarily price and availability.

    As this "blend wall" is approached, we are currently seeing this "price dynamic" being played out, with reports that the EPA will likely reduce required 2014 ethanol levels below the "targeted" RFS levels.

    Understanding the basics of this "pricing dynamic" for fuel blends >10% (E-15 to E-85) is pretty easy. Per the EPA, ethanol (E-100) contains ~30% less energy content than gasoline. Thus, simply comparing the market price of ethanol versus gasoline is an un-useful "apples to oranges" comparison. An adjustment must be made for this inherent "energy content penalty" (less MPG).

    The below graphic illustrates this, where ethanol (E-100) is currently 83� per gallon cheaper than gasoline ($2.64 minus $1.81). Applying the "energy content penalty", the price point where a consumer would be currently indifferent to gasoline or ethanol would be an ethanol cost of $1.85 per gallon ($2.64 times 70%).

    Currently, the price of ethanol represents a very small savings of 4� per gallon. But for much of 2013, ethanol's "adjusted" cost has been much higher than gasoline -- as a result of high corn feed-stock prices from drought in the Mid-West.

    Certainty and Uncertainty of the Future.   It is believed that the future of ethanol and bio-fuels will likely follow one of two paths:

  • Low Growth -- E-10 continues to be used in almost all gasoline
        to comply with clean-fuel regulations. E-15's use is limited
        in the U.S., with market growth coming primarily from Mid-
        western States (where most U.S. ethanol is produced).
  • High Growth -- Demand for very high levels of ethanol (E-85
        and even E-100) increases dramatically throughout the U.S. as a
        result of technology advancements in:
          (1) Cellulosic ethanol production that significantly lowers costs;
          (2) Automotive engineering (engine turbo-charging) that
                reduces the "MPG penalty" of ethanol.
  • There are two areas of future technology advancements to keep an eye on. The first is in the development of cost effective enzymes to break down celluloic feedstocks (e.g., switchgrass, energycane, crop waste, etc.) into fermentable sugars for ethanol production. As the above chart on the Renewable Fuel Standard illustrates, cellulosic (non-corn feedstock) ethanol was always envisioned as the long-term future of ethanol.

    One type of feed-stock source that could buy time until enzyme development reaches its full potential is the use of "bridge crops" (such as drought resistant sweet sorghum) using a hybrid approach of plant sugar (brix) extraction and also enzyme technology on the crop's waste steam (i.e., bagasse, presscake).

    A second area to watch is in automotive technology advancements of the "incredible shrinking engine size". We are already seeing early glimpses of this technology being introduced into the marketplace with Ford's "Eco-boost engines". A key building block in understanding ethanol's role in engine advancements of "turbo-charging" is octane content:

    Ethanol Vs. Gasoline
    Comparison:
    Octane
    Rating
    Ethanol (E-100)
    113
    Unblended Gas (E-0)
    84

    While our future blogs will get "Geeky" in discussing turbo-charging advancements -- The basic concept is the development of smaller engines requiring high octane levels (as found in ethanol) that generate greater power. A simplistic "Average Joe" visualization would be putting an engine the size of a Volkswagen Beetle into a large SUV, and providing the same performance to the driver.

    With smaller engines having less weight and increased efficiency (e.g., running cooler), Ricardo Engines (a leader in turbo-charging) suggests that ethanol's (E-100) current "MPG penalty" could be reduced from 30% to 14%. Applying this lower "MPG penalty" to today's gasoline prices would result in current ethanol (E-100) savings of 46� per gallon.

    Note on MPG Penalty: The highest blend of ethanol sold in retail gasoline is E-85. In AAA's daily tracking of retail gas prices, a MPG Penalty for E-85 of 24.018% is used (vs. ~30% for E-100). E-85's MPG Penalty using the potential Ricardo efficiency gains is 10.418% (vs. 14% for E-100).
    Current Ethanol Wholesale Commodity Price
    Current Gasoline Wholesale Commodity Price
    Current E-85 Retail Prices by State
    Current National Average Gasoline Prices

    Thursday, 17 October 2013

    Computer simulation . . . What's that?

    Posted by Sohail Azad On 17:26


    In previous posts, I have used the concept �Computer Simulation� many times. For example, I have affirmed that �Computer Simulation is the right tool to decide truck allocation�, and �To calculate the aggregate variability, it is necessary to use sophisticated computational tools such as Computer Simulation�, and finally �Computer Simulation could aid in planning mining operations�.

    All those statements assume that the reader is familiar with the concept �computer simulation�. However, that is not always the case. In this post, I will explain briefly in plain English what computer simulation is, and will briefly describe the different types of simulation.
    1. Modeling a complex system

    When working in complex systems, managers often need to plan operations, forecast results, and test �what if� scenarios to maximize outcomes and increase efficiency. Usually, making changes to the real system is impossible or too expensive. In other situations (as in feasibility studies) there is no such �real system� to test or modify. Therefore, managers can use models to aid these tasks.


    Reality is complex, no doubt. Let�s think of a copper mine or a Hospital. Operations in both places are complex. Moreover, the duration of real processes (e.g. loading a truck in a mine or providing care to a hospitalized patient) are stochastic in nature.

    As Dr. George E.P. Box said, �All models are wrong, but some are useful�. Therefore, the degree of usefulness of a model depends on its accuracy to replicate: i) processes, ii) decision making rules, and iii) relationships between the system components.

    2. The advent of computers

    When I was 12 years old my father bought me a simple calculator. I was amazed with how this tiny machine could perform simple mathematical operations so quickly and reliably. When I was 20, I bought my first programmable CASIO calculator. Once again, I was amazed about how, through a simple BASIC program, complex mathematical and statistical operations could be accurately performed. As a university student, I bought my first �very expensive� laptop computer (12Ghz clock speed, 20MB hard drive, and 800Kb RAM) and learned how to program in Pascal, FORTRAN, and C++.

    Nowadays computers are accessible to almost everybody. They are incredibly powerful and cheap in comparison with the one that I used at the university!

    Unfortunately not all companies have in-house knowledge and resources to develop computer programs and to model complex systems. What companies normally have is one spreadsheet software (e.g. Excel) originally designed for accounting purposes. 

    Managers, employees, and even engineers, tend to modify their way of thinking based on available tools and end up modelling complex systems using the spreadsheet software.

    The �evil� combination of spreadsheet software, averages, and simplified mathematical models, totally ignores the inherent variability of complex systems and therefore generate poor and potentially misleading results (see one of my previous posts).

    3. So, What is computer simulation?

    In simple words, computer simulation consists in digitally mimicking real systems using computers and specialized software. The idea is to represent the real system as closely as possible to replicate its behavior and outcomes.

    Computers are very useful to model complex systems using algorithms, statistical functions and random generated numbers. Nowadays specialized software (e.g. ExtendSim and ARENA) allow us to model complex systems in a very efficient way.

    This virtuous combination of accessible computer power and specialized software, has changed the way we model complex systems. The scale of problems that could be simulated using computers surpasses every imaginable paper-and-pencil mathematical modeling capabilities!

    To date, computer simulation is successfully used in logistics, weather forecasting, games, traffic, economy, engineering, aerospace, etc.

    Normally, a simulation process consists of:
    • Analysis and study of the real system (i.e. components, relationships, decision rules),
    • Data collection and analysis (e.g. probability distribution fitting),
    • Model design,
    • Model validation,
    • Model calibration,
    • Simulation runs, and
    • Analysis of the results.
    4. Are there different types of computer simulation?

    I am pretty sure that you have heard the term �Montecarlo Simulation�. This type of simulation refers to a broad class of mathematical modeling algorithms that rely in random generated numbers. By running the simulation many times using different random numbers as input, different results will be obtained allowing the modeler to perform a statistical analysis on them. Montecarlo Simulation is typically used in engineering (e.g. fluids dynamics, solids), business (e.g. risk analysis), and mathematics.

    Another type of simulation is called Continuous Simulation (CS). These deterministic simulations use complex differential equations to represent relationships among the different components of the modeled system. In these simulations, time varies continuously and the variation in the state of the system components is also continuous. Results are normally real numbers represented in continuous graphs. Typical use of CS are: population growth estimations, disease transmission analyses, and large systems� behavior studies.

    On the other hand, Discrete Event Simulations (DES) represents real systems composed by entities and a discrete sequence of events.

    Entities (e.g. trucks in open pit mining or patients in hospitals) are �processed� in different stations (e.g. crusher or hospital beds). Processing times are normally stochastic and therefore the modeler represent these times through a theoretical or empirical probability distribution.

    Events occur when an entity enters or leaves the processing station and constitutes a �change of state� in the system.

    Time in DES is not continuous and therefore the simulation clock jumps from one event to the next one allowing the simulation to run faster than in CS.

    A special type of DES is the �agent-based simulation� (more information can be found HERE).

    5. What type simulation is the most appropriate for me?

    This is not a simple question and depends on your objective. Let�s analyze some examples:
    • If you want to simulate how the rock fractures in blasting, a Montecarlo Simulation in junction with complex mathematical models (e.g. using finite elements) are appropriate.
    • If you want to simulate the long term behavior of Chile�s copper production given certain changing environmental, political, and economical factors, Continuous Simulation is the appropriate tool,
    • If you want to simulate material transportation and ore production in an open pit mine to evaluate different operational schemes, Discrete Event Simulation is the appropriate tool,
    • If you would like to right size the fleet of trucks (capacity planning) for a given production scheme, also discrete event simulation is the appropriate tool, and finally
    • If you would like to right size the number of beds in a hospital, Discrete Event Simulation is the right tool.
    Let�s now elaborate a little bit more on why DES is the appropriate tool for capacity planning and scenario planning in mining operations.

    First, mining operations have a finite and discrete number of entities (e.g. trucks) that have a certain number of characteristics (e.g. capacity, speed, availability). Using DES we can simulate trucks as entities and assign to them different attributes. During the simulation, these attributes will be used to modify the entity behavior and to set the processing times in some processing stations. Also, each entity (truck) could have associated a certain probability of failure to represent unplanned maintenance events. These parameters could vary on each of the simulated entities as happens in the reality.

    Second, for each simulation run we are interested in recording the behavior of these entities. For example we would like to know how many kilometers a certain truck covered during one shift. DES can record, analyze and present in graphs, a huge amount of information generated during each run.

    Third, we would like to simulate a certain finite time (e.g. one shift or one year) as fast as possible. Since the simulation clock in DES jumps from one event to the next one, one can simulate extended periods of time in seconds.

    Forth, DES is able to represent real stochastic processes through probability distributions.

    Fifth, DES can run the same scenario multiple times generating different results (e.g. total ore produced in a year). These results vary in each run following a certain unknown probability distribution. As explained in one of my previous posts, it is not possible to estimate the aggregate variability of the whole process using analytic methods. Therefore, by analyzing the results generated in multiple DES runs, we can estimate this aggregate variability and establish a confidence interval for the expected result (i.e. expected production level).

    Sixth, complex transportation networks can also be simulated accurately using DES. Roads can be divided in segments with certain individual characteristics (e.g. capacity, longitudinal distance, elevation). A decision point can be added at the entrance of each segment to accurately represent traffic rules.

    6. DES require lots of data to model a complex system. Where can I find it?

    The good news is that most mines have a dispatching system that collects tons of information. This facilitates the distribution fitting and the calibration of the model.

    In those situations where the dispatching system does not collect information (e.g. the time spent by the rock breaker in breaking big rocks that occasionally jam the crusher) one can perform time-studies to estimate the approximate probability distribution of the process.

    7. OK, I got it. DES is the appropriate tool to simulate complex systems. So what? I still need to optimize their performance . . .

    Simulation and optimization are not synonymous. As mentioned before, simulation mimics the real system as close as possible. On the other hand, optimization techniques are intended to find an optimum.

    The good news is that we can use both simulation and optimization techniques together to find the optimum operational scheme. There are some very interesting techniques to test different scenarios and find the best one (e.g. Design of Experiments). On the other hand, some simulation software (e.g. ExtendSim) have optimization capabilities that can be efficiently used to find the optimum.

    8. Is there a simulation software that I can use to model and optimize open pit mining operations?

    Indeed there is!

    MineSimulator 3.0 is the perfect tool to simulate these complex operations and to find the optimum operational scheme!

    More information about computer simulation can be found in the ExtendSim website.

    Rene Alvarez, IE, MEng
    www.SmartSimulation.ca

    Friday, 6 September 2013

    Happy Dependence Day to Mid-East Oil and China!

    Posted by Sohail Azad On 07:36

    This past Independence Day, a mostly overlooked news story was China becoming the largest benefactor of American blood and treasure spent in Iraq (~5,000 soldier deaths and $1.9 trillion) -- as China is now Iraq's #1 oil customer (purchasing ~50% of Iraqi oil with expectations that this will increase).

    But this story line isn't limited to Iraq, as China is now also the #1 oil customer of many oil exporting countries in the Persian Gulf -- benefiting from U.S. military protection of the Region's oil supplies (with an estimated U.S. cost of ~$8 trillion during the past 3 decades -- about $27,000 per each U.S. Citizen).

    Since Chinese Oil Companies are controlled by their central Government, this shouldn't come as a shock. Unlike U.S. and other Western Oil Companies, China is not driven by shareholder profit but national interest to fuel their economic growth. Simply stated, China is willing to pay more to develop these oil resources than western multi-national corporations (e.g., Exxon, Shell, BP, etc.). Even by paying more for oil, China will still retain a competitive advantage over most U.S. manufactured goods as a result of their cheaper labor, currency devaluation (Yen), and lax environmental regulation (including carbon dioxide).

    The below graphic from the U.S. Energy Information Agency is a timeline depiction of Chinese oil consumption that has been needed to fuel their staggering economic growth during the past +30 years:

    As Americans now prepare for the likelihood of even more war in the Middle-East, the footprint of oil re-surfaces yet again -- with recent news reports that Iran (through Russia) has been funneling billions of dollars to the dictator Assad to develop oil resources in Syria.

    Starting with the funding for the 9/11 World Trade Center attack (Saudi Arabian sources) to the current deadly civil war in Syria -- a common denominator just always seems to be oil money that supports international terrorism and wars for political/religious control in the Region.

    This Labor Day as the U.S. prepares for war, Americans should remember that every time we fill up our gas tanks:

    Through the hard earned money of our labor -- we are supporting this unending madness and opportunism for China to exploit.

    While U.S. foreign oil dependence has significantly decreased in the last few years due to technology advancements in hydraulic fracturing (where its long-term impact on water resources is uncertain), we should not lose sight that the U.S. still imports a tremendous amount of oil -- much of which comes from volatile OPEC countries.

    To put this into context, U.S. oil imports from OPEC in 2012 approximately equaled or exceeded the "total oil consumption" of other leading industrialized countries:

    U.S. OPEC Imports Versus Total Oil
    Consumption of Major Countries
    This Labor Day as we celebrate the "American Spirit" of hard work, creativity, opportunity, and resolve, it should be recognized that ethanol is a perfect example of this "Spirit" -- and just how far we've come in such a short period of about 10 years.
    Unfortunately, many politicians today want us to go back to the "Good Old Days" of dirtier fuel and greater fossil fuel dependence by rescinding Renewable Fuel Standards. These politicians would also abandon the vision to dramatically increase auto fuel economy (54.5 MPG) through the development of highly efficient, smaller turbo-boost engines (requiring the high octane found in ethanol).

    The next time you hear an opportunist politician rail about "Big Government forcing ethanol down consumer's throats" -- think about which picture of values you want to support when you fill up your gas tank.

    Monday, 26 August 2013

    Returning to the Roots of Ethanol's Importance

    Posted by Sohail Azad On 14:36

    Ethanol Protects Our Most Vulnerable By Providing Cleaner Gasoline.

    Critical in forming public opinion on any issue is the use of paradigms -- an explanation "model/view" of how something works. With paradigms it often doesn't matter if the underlying facts/logic are incorrect or not objective (cherry-picked), its only what the Public perceives as correct or true that matters.

    With many public perception paradigms there is usually a strong underlying cause as to why certain beliefs can often be so easily accepted -- such as mistrust by Conservatives in "big government" taking away individual freedoms (spawning conspiracy theories). Two current examples of this affecting public health policy are efforts to eliminate fluoride in drinking water (for dental health) and vaccinations (for children's health).

    In today's world of mass communication (e.g., the Internet, battle of viewer ratings, etc.), forming public paradigms can be easily accomplished by the use of simple "sound bites" -- where something can be quickly "demonized".

    An example of a highly effective quick sound bite demonization is Sarah Palin's use of fruit fly research to define a paradigm of ubiquitous wasteful Government spending (even though this science research is critical in finding cures for genetic diseases in humans, such as childhood autism).
    (Click for the sound bite)

    In forming public perception paradigms, a highly effective technique is to "cherry pick" aspects of an issue in order to "frame" the public debate -- forcing opponents to always be on the defensive to specific charges/claims. In the current "War on Ethanol" this is exactly what's happening as ethanol supporters constantly find themselves fighting a public perception of another highly subsidized, big-government, and wasteful program.

    Ethanol Supporters must recognize that a strategy limited to "only" refuting claims point-by-point (e.g., engine damage, diverting crops for fuel use resulting in high food costs and world hunger, etc.) is not likely to be successful -- something more is needed.

    In the classic movie comedy "My Cousin Vinny", a New York City lawyer (Vinny, played by Joe Pesci) defends his cousin on false murder charges in the State of Alabama (a pretty tough place for a Brooklyn lawyer). In one funny scene, Vinny objects to the Prosecutor's question, where the Judge responds to him: "That is a lucid, intelligent, well thought out objection -- OVERRULED!"

    Often, even the best of well thought-out and factual arguments can not overcome ingrained prejudices and biases -- especially in today's Red State versus Blue State culture wars.

    In the "Court of Public Opinion" on ethanol what is needed is a "Paradigm Shift" to change the playing field. A good starting place is to return to the original public health benefits roots of why ethanol use was needed in the first place:

    Octane: Octane is an additive needed to reduce the reaction of unblended gasoline to combust/ignite under pressure in a car's engine cylinder (called anti-knock). Without proper octane levels in gas, engine performance levels will decrease and will cause engine damage. For decades, the principle source of octane was lead, which according to every World Health Organization was resulting in severe health problems (e.g., central nervous system damage, neurological development in children, fertility problems, high blood pressure, kidney damage).

    Ethanol has a high octane rating (~113), where the majority of gasoline today is blended with ~10% ethanol (called E-10) to achieve the needed regular grade octane rating level of 87 for proper engine performance:

    Gas
    Component:
    Octane
    Rating
    Percentage
    Blend
    Weighted
    Octane
    Ethanol (E-100)
    113
    10%
    11.3
    Unblended Gas (E-0)
    84
    90%
    75.7
    Gas @ Pump (E-10)
    87
    100%
    87

    Cleaner Air from Less Smog: If you live in a metropolitan area, have you noticed that there is less smog air pollution (severely impacting lung functions of children and the elderly) than a decade ago? This was accomplished by adding an oxygenate additive in gasoline, making it cleaner burning. First an oxygenate called MTBE (derived from fossil fuels) was used, but was found to be probably carcinogenic (cancer causing). Ethanol has replaced the use of MTBE.

    Health Benefits Vs. Costs: While the health benefits (e.g., reducing rates of cancer, child autism, asthma, etc.) of cleaner gasoline from ethanol blending are immeasurable, what is the cost that consumers have to pay for these benefits by using ethanol? To answer this question, we need to look to non-ethanol alternatives for (1) oxygenates (ethers) and (2) octane additives (alkylates).

    A first step is to compare the wholesale commodity price of un-blended gasoline (E-0) versus ethanol (E-100) -- where currently, ethanol is trading at a "discount" of $0.92 per gallon (yes, you are reading this right, a discount not a premium).

    Commodity Price of Gas Versus Ethanol
    (per gallon)
    Removing ethanol as the source of a needed oxygenate and octane additives would eliminate this "discount", resulting in an ~9� per gallon price increase at the pump (e.g., price difference of $0.92 per gallon times the typical 10% blending ratio). But in doing this, the ethanol-free gas would then have a performance problem as it only contains 84 octane (versus minimum requirements of 87).

    To estimate what the additional costs would be to make up for this short-fall in octane level, we can look to current pump prices where the higher octane levels in mid and premium grades are achieved by non-ethanol additives (alkylates, aromatics and reformates).

    Comparison of Average U.S. Gas Prices by Octane Grade

    Regular
    (87 Octane)
    Mid-Grade
    (89 Octane)
    Premium
    (91 Octane)
    Pump Price Per Gallon
    $3.57
    $3.74
    $3.90
    Octane Level Vs. Regular
    -
    +2
    +4
    Increased Cost Over Regular
    -
    17�
    33�

    Using the above market data, eliminating ethanol blending in gasoline (for oxygenate and octane requirements) would result in a pump price increase of ~34� per gallon:

    Consumer Cost Impact:
    Increase in Price per Gallon:
    Elimination of Ethanol Discount
    9�
    Non-Ethanol Octane Additives
    25� (1)
    Pump Price Increase
    34�
    (1) Based on the above pump premiums for mid and premium grades, for each incremental increase in octane level of 1, the increased price is ~8�.

    Thus, contradictory to the paradigm presented by opponents of ethanol (e.g., recent actions by the State of Florida to eliminate blending requirements), ethanol use "reduces" the cost to consumers in achieving health objectives versus other alternatives.

    Conclusion: In a culture of increasing ideological divides and short memories (what have you done for me lately?), the ethanol story of health benefits (especially for children) must be re-emphasized and re-told -- and that its just not another "big government" wasteful program shoved down the public's throat.

    Also the current myopic view of the environmental community in criticizing ethanol should be taken to task on these health issues. What do they propose to use for the massive octane and oxygenate additives needed to cleanly sustain U.S. transportation?

    Only by achieving a fundamental "paradigm shift" in attitudes will the general public even listen to the "point-by-point" argument rebuttals being made in support of ethanol.

    References:
    Reuters News Article Analysis of Ethanol
    Life Without Ethanol
    How Stuff Works: How Gasoline Works